
Manufacturers for many years dealt with an 80/20 split of reliable sourcing versus uncertainty and variability. Now the dynamic has flipped – closer to 80 percent of inventory has long lead times and higher variability.
The supply chain has broken faster than it can be fixed, which means many manufacturers have lower confidence in managing their inventory. And managing inventory has always been a challenge because:
- While sales forecasts have been the default planning metric, demand is more complex than a single number for sales translating to annual consumption or usage.
- Forecast-based master schedules work great in theory but not so well in actual practice
- ERPs do not play well with real-world seasonality and demand variability
- There are complex tradeoffs between batch size, lead time, risk, and cost.
The inventory management solution for many small- and medium-sized manufacturers (SMMs) is a statistical engine that helps them take a more proactive approach to decisions about costs and tradeoffs such as:
- What is the optimum batch size?
- Flexibility vs. predictability
- Cost vs. customer service level
- Cost of extra inventory vs. cost of rush jobs
- How much is it worth to reduce setup time or lead time?
SMMs are looking for simple tools, but traditional systems do not typically provide ways to see and support these decisions. A properly designed supermarket makes these tradeoffs visible and explicit. Let’s take a look.
What Does a Supermarket Toolkit Look Like
 Enterprise Resource Planning (ERP) systems work great if the sales forecast, external lead times, internal lead times, and many other variables are correct. In that case, the system will generate purchase orders and work orders that result in finished goods produced in exactly the right quantities at exactly the right time. The real world is not so neat. Master schedules require a great deal of care and can be challenging when dealing with seasonality, variability, and real-time changes such as with lead time or demand. Hence, the traditional mismatch between inventory and demand.
Our experts at the Vermont Manufacturing Extension Center (VMEC) applied statistical tools to the traditional minimum/maximum inventory systems. They began with the idea that more of the right stuff at the right time was a better model to account for variability of demand and seasonality than the “just in case” excess inventory approach.
They developed a supermarket toolkit of detailed algorithms based on historical data to calculate three buffers for every part number, as well as easy adjustments for real time knowledge, which helps provide the right inventory at the right time. This sophisticated supermarket/pull system features:
- Detailed data analytics in a parametric model with an easy to use dashboard and trade-off tools
- Defined internal processes and roles for system management
- Training and documentation
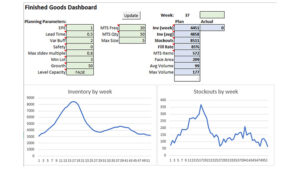
 This toolkit starts with an assessment of data of historical consumption by SKU by week. The dashboard shows real-time status in relation to the plan, and it highlights what needs to be replenished now or what is at risk of an eventual stock out. Different inputs can be adjusted, which is particularly impactful for the ability to manage exceptions and the key parameters that drive sales and inventory issues. The toolkit also includes planning tools for floor space and storage racks.
Analyze Your Historical Data to Assess Inventory Needs
Inventory management is not just about minimums required for production; it also is about the maximums to carry. This is where historical data can add value beyond yearly projections. For many products (giftware, flower seeds, or tick repellent), the consumption follows a predictable curve. Consumption data allows for lower average inventory while still covering the peak needs. In the model, replenishment is based on consumption data rather than a master schedule or a traditional pull set up that replenishes everything that is removed from the supermarket. For people on the floor, the model based on consumption data is much easier to see and understand what’s happening.
Collect historical data for:
- Demand: Averages and variability, trends, and seasonality
- Supplying process: Lead time, batch size, reliability, and capacity
The model allows you to view your inventory from multiple signaling points or critical control points. This is especially important ahead of seasonal factors, knowing where you need to be coming into a key point and what is needed coming out of that point.
Target inventory is based on a statistical analysis of demand variability. If the week-to-week usage for a specific part is highly variable, you can plan on carrying more inventory to decrease the chance of running out. The data may also help manage inventory space needs and shelf life.
For example, one company had a family of products for weddings and another for Christmas.
Drilling down into the historical data helped them understand how to better manage inventory for what was needed at different times. They were able to reduce their average Finished Goods inventory costs from $1 million to $320,00 while increasing shelf availability/fill rate from 80 percent to 93 percent.
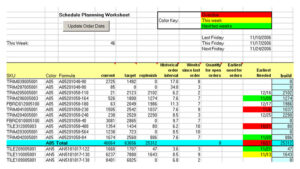
Design Your Plan by Item and Week, Then Test Parameters
The data analysis will help planners see what drives inventory. The model, which operates much like formulas in a spreadsheet, provides immediately visible impacts of proposed changes in things like lead time, batch size, or setup reduction.
A planner can also change the inputs on key parameters, such as the impact of buying more supplies or extending production time. How does a change from 8 weeks for a part delivery to 16 weeks change inventory cost and stockout risk? The parameters can be varied by a global view (such lead time) or by impacts from an individual SKU.
In essence, the model quantifies the impact of demand variability, supplier reliability, batch size and lead time, which helps drive decisions.
The model can also show what would have happened if the proposed inventory plan had been in place with the previous year’s orders. A Vermont manufacturer was able to see how the proposed plan would have resulted in fewer stockouts and less total inventory.
Model Can Help With Risk Avoidance, and Direct and Indirect Impacts
The statistical engine allows you to apply risk management on your most important items, areas in which you are likely to have supply issues, and processes with no easy workaround. You can more easily identify:
- How to work with suppliers
- What to seek out in new sources
- How to vary batch size
- Where to consider the use of alternative parts
- When to Increase inventory for priority and at-risk parts
Another benefit of the statistical model is it can provide higher confidence in some aspects of your supply chain, which means you may be able to redesign a part or a process. You are armed with more options. This confidence can also help you evaluate your:
- Growth scenarios and other changes to project orders
- Rack space and volume, what is needed versus what is available
- Replenish signals
- Facility layout considerations
Results: What to Expect From an Investment into a Statistical Engine
Our engagements at VMEC address workforce practices and processes through assessments, team development, training and system improvements. You can expect:
- Sales growth/retention: Increased capacity and improved service levels
- Cost reduction: Typical one-time inventory reduction
- Cost avoidance: Simplified processes, reduced handling and expediting.
There also could be gains in margin, which could impact the sales process, or one-time expenses in racking and shelving, bins, and other equipment to support a supermarket.
The role of the planner also changes significantly. Rather than generating a detailed master schedule for every part, they instead respond to changes in demand levels or patterns. Think of handling exceptions rather than doing everything.
Ultimately, one of the primary benefits is that the statistical engine allows a real-time tradeoff analysis: What’s the incremental risk of stockouts vs. cost of inventory?
Your Local MEP Center Can Help With Tools for Inventory Management
Inventory management has always been about the tradeoff between costs and risks. A well-designed supermarket provides tools to manage those tradeoffs. Your local MEP Center can help you with the tools to support a proactive approach to risk mitigation for your inventory management. Let’s talk.
About the authors: Lisa Henderson, Director of Client Services, VMEC and Bill Kuhns, VMEC service provider and President, Cedar Lake Design Inc. Lisa is certified as an Innovation Engineering Black Belt and works with Vermont companies to implement management systems. Bill is a former VMEC field engineer who is owner-operator of a computer software and services firm.